Developer Tools help developers write and debug websites on Firefox. This newsletter gives an overview of the work we’ve done as part of the Firefox 131 Nightly release cycle.
Firefox being an open source project, we are grateful to get contributions from people outside of Mozilla:
- Mathew Hodson added a link to MDN next to
Priorityheader in the Network Monitor (#1894758) - Gregory Pappas reduced usage of hidden windows in the Firefox codebase, which we were using in a few places in DevTools (#1546738, #1914101, #1914107, #1915014)
- Christian Sonne helped us making it possible to change CSS values with the mouse wheel (#1801545). More details on that later.
Want to help? DevTools are written in HTML, CSS and JS so any web developer can contribute! Read how to setup the work environment and check the list of mentored issues
Supercharging CSS variables debugging
CSS variables, or CSS custom properties if you’re a spec reader, are fantastic for creating easy reusable values through your pages. To make sure they’re as enjoyable to write in your IDE as to debug in the Inspector, all vendors added a way to quickly see the declaration value of a variable when hovering it in the rule view.
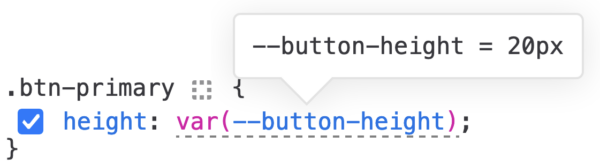
This does work nicely as long as your CSS variable does not depend on other variables. For such cases, the declaration story might not give you a good indication of what is going on.
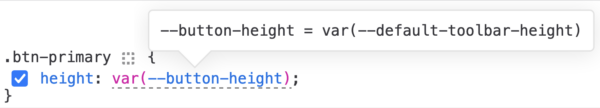
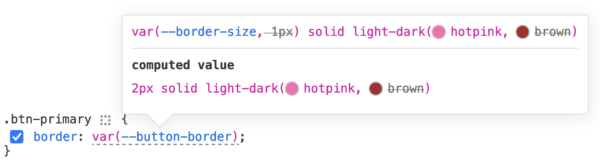
--default-toolbar-height value?You’re now left with either going through the different variable declarations to try to map the intermediary values to the final one, or look in the Layout panel to check the computed value for the variable. This is not super practical and requires multiple steps, and you might already be frustrated because you’re chasing a bug for 3 hours now and you just want to go home and relax! That happened to us too many times, so we decided to show the computed value for the variable directly in the tooltip, where it’s easy for you to see (#1626234).
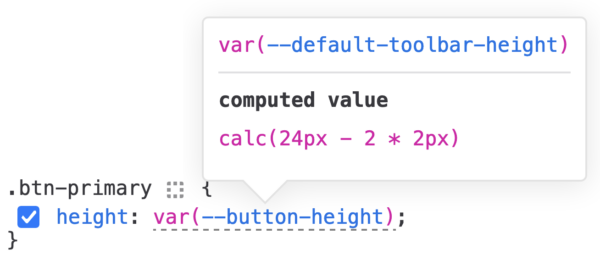
This is even more helpful when you’re using custom registered properties, as the value expression can be properly, well, computed by the CSS engine and give you the final value.
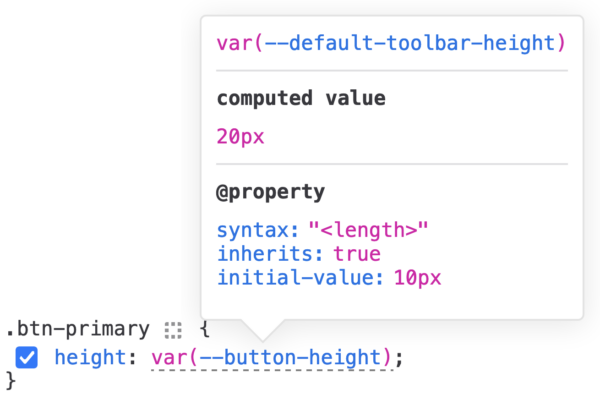
Since we were upgrading the variable tooltip already, we decided to make it look good too, parsing the values the way we do in the rules view already, showing color preview, striking through unused var() and light-dark() parameters, and more (#1912006) !
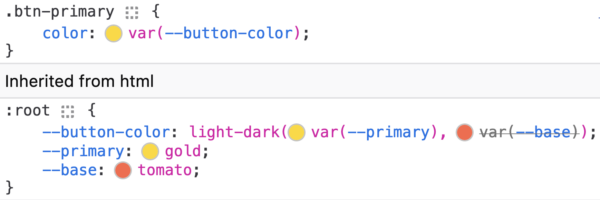
What’s great with this change is that now that we have the computed value at hand, it’s easy to add color swatch next to variables relying on other variables, which we weren’t doing before (#1630950)
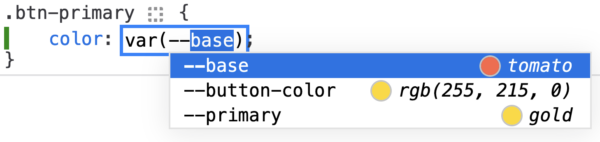
Even better, this allows us to show the computed value of the variable in the autocomplete popup (#1911524)!
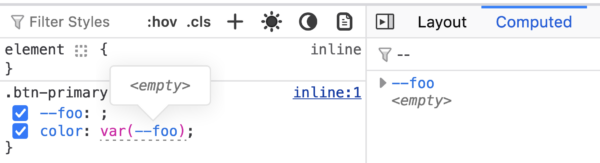
While doing this work and reading the spec, I learnt that you can declare empty CSS variables which are valid.
(…) writing an empty value into a custom property, like
https://www.w3.org/TR/css-variables-1/#guaranteed-invalid--foo: ;, is a valid (empty) value, not the guaranteed-invalid value.
It wasn’t possible to add an empty CSS variable from the Rules view, so we fixed this (#1912263). And then, for such empty values, we show an <empty> string so you’re just not left with an empty space, wondering if there’s a bug in DevTools (#1912267, #1912268).
Enhanced Markup and CSS editing
One of my favorite feature in DevTools is the ability to increase or decrease values in the Rules view using the up and down arrows from the keyboard. In Firefox 131 you can now use the mouse wheel to do the same things, and like with the keyboard, holding Shift will make the increment bigger, and holding Alt (Option on OSX) will make the increment smaller (#1801545). Thanks a lot to Christian Sonne, who started this work!
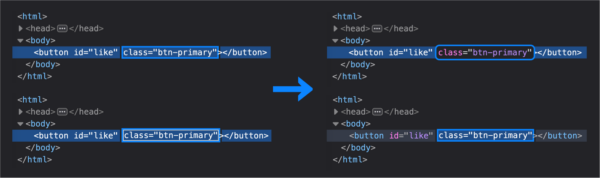
Editing attributes in the markup view was far from ideal as the differences between an element attribute being focused and the initial state of attribute inputs was almost invisible, even to me. This wasn’t great, especially with all our work on focus indicator which aims to bring clarity to users, so we improved the situation by changing the style of the selected node when an attribute is being modified, which should help make editing less confusing (#1501959, #1907803, #1912209)
Bug fixes
In Firefox 127, we did some changes to improve performance of the markup view, including how we detect if we should show the event badge on a given element. Unfortunately we also completely broke the event badge if the page was using jQuery and Array prototype was extended, for example by including Moo.js. This is fixed in this Firefox 131 and in ESR 128 as well (#1916881)
We got a report that enabling the grid highlighter in some specific conditions would stress GPU and CPU, as we were triggering too many reflows, as we were working around platform limitation to avoid rendering issues. This limitation is now gone and we can save up cycle and avoid frying your GPU (#1909170).
Finally, we made selecting a <video> element using the node picker not play/pause said video (#1913263).
And that’s it for this months folks, Thank you for reading this and using our tools, see you in a few weeks for a new round of updates 🙂
Full list of fixed bugs in DevTools for the Firefox 131 release:
- Gregory Pappas [:gregp] Get rid of the hidden window usage to get a WebSocket object (#1546738)
- Gregory Pappas [:gregp] Stop using hidden window in browser_key_shortcuts.js (#1914101)
- Gregory Pappas [:gregp] Stop using hidden window in adb-addon.js (#1914107)
- Gregory Pappas [:gregp] Remove fallback to hidden window in ParentProcessTargetActor._getInitialDocShell (#1915014)
- Mathew Hodson Add MDN link for Priority header (#1894758)
- Jonathan Kew [:jfkthame] CSS value suggestion for white-space doesn’t include normal, pre, pre-line, pre-wrap (#1913536)
- :Gijs (he/him) Stop setting javascript.options.asyncstack_capture_debuggee_only manually from devtools mochitests (#1822975)
- Benjamin VanderSloot [:bvandersloot] Cannot save JSON results from file:/// url or blob object URL (#1872307)
- Alex Thayer [:alexical] (she/her) Implement a native backend for the JS tracer (#1906719)
- Tooru Fujisawa [:arai] Debugger.findObjects class filter could also match prototype/constructor name (#1908650)
- Web Platform Test Sync Bot [:wpt-sync] (Matrix: #interop:mozilla.org) [wpt-sync] Sync PR 47478 – automate console-count-logging test (#1911790)
- Emilio Cobos Álvarez (:emilio) Assertion failure: mParentSheet->ChildSheets().Contains(this) (#1914449)
- Alexandre Poirot [:ochameau] Re-enable devtools/client/debugger/test/mochitest/browser_dbg-browser-toolbox-workers.js test for Fission (#1685412)
- Nicolas Chevobbe [:nchevobbe] [markup-view] “Add attribute” input should have a 1 character left margin (#1501959)
- Nicolas Chevobbe [:nchevobbe] Display the computed value of custom properties on hover, where they are defined (#1626234)
- Nicolas Chevobbe [:nchevobbe] color swatch isn’t added for nested CSS variables (#1630950)
- Julian Descottes [:jdescottes] Firefox devtools: allow changing values with mouse scroll (#1801545)
- Julian Descottes [:jdescottes] Seeing a “destroyed actor” error message while remote debugging Android WebExtensions (#1856481)
- Nicolas Chevobbe [:nchevobbe] Consider fading the unused value from light-dark() colors. (#1857006)
- Julian Descottes [:jdescottes] Developer Tools: Network status bar is misplaced after switching tabs (#1871762)
- Nicolas Chevobbe [:nchevobbe] Create Codemirror 6 inline editors for breakpoints panel (#1890205)
- Hubert Boma Manilla (:bomsy) The cursor location doesn’t update when clicking in the document (#1898204)
- Nicolas Chevobbe [:nchevobbe] Focused tagname/attribute is hard to differentiate from inplace editor input with selected text (#1907803)
- Nicolas Chevobbe [:nchevobbe] Showing “grid overlay” in the devtools will stress GPU and CPU (#1909170)
- Nicolas Chevobbe [:nchevobbe] Turn InplaceEditor cssVariables (Map) option into getCssVariables (Function) so it’s only called when needed (#1911510)
- Nicolas Chevobbe [:nchevobbe] Display computed value of CSS variable in rules view InplaceEditor autocomplete (#1911524)
- Nicolas Chevobbe [:nchevobbe] Rule view shows CSS variable value in declaration instead of declaration text when variable uses light-dark() (#1911525)
- Nicolas Chevobbe [:nchevobbe] Registered properties value with CSS wide keywords (inherit, unset, initial, revert, revert-layer) are indicated as invalid at computed value time (#1911619)
- Nicolas Chevobbe [:nchevobbe] Use OutputParser in var() tooltip to display values (#1912006)
- Nicolas Chevobbe [:nchevobbe] Clicking elements in the markup view might apply :focus-visible style (#1912209)
- Nicolas Chevobbe [:nchevobbe] Can’t add an empty CSS variable from the Rules view (#1912263)
- Nicolas Chevobbe [:nchevobbe] Display empty CSS variable value in var() tooltip differently (e.g. `<empty>`) so it’s easier to understand (#1912267)
- Nicolas Chevobbe [:nchevobbe] Display empty CSS variable value in computed panel differently (e.g. `<empty>`) so it’s easier to understand (#1912268)
- Nicolas Chevobbe [:nchevobbe] Empty computed value isn’t displayed in variable tooltip (#1912285)
- Nicolas Chevobbe [:nchevobbe] CSS variable tooltip should have a smaller max width (#1912411)
- Nicolas Chevobbe [:nchevobbe] Only show CSS variable value in variable tooltip (remove “–x = “) (#1912995)
- Julian Descottes [:jdescottes] Intermittent TV devtools/client/netmonitor/test/browser_net_layout_after_toggle.js | single tracking bug (#1913039)
- Hubert Boma Manilla (:bomsy) The Debugger panel has crashed. (#1913061)
- Julian Descottes [:jdescottes] Developer tools: Inspector picker plays/pauses video (#1913263)
- Julian Descottes [:jdescottes] Stop using mask-image for source debugger icon (#1913285)
- Nicolas Chevobbe [:nchevobbe] Set cursor blink rate from ui.caretBlinkTime (#1913343)
- Julian Descottes [:jdescottes] Fix propTypes warnings when using the console (#1913472)
- Hubert Boma Manilla (:bomsy) Remove legacy code to handling escaping out of the debugger editor which is causing issues (#1913693)
- Julian Descottes [:jdescottes] Move the network overrides to a shared toolbox reducer AcceptedPublic (#1914657)
- Nicolas Chevobbe [:nchevobbe] Add test for editing declaration of layer-imported stylesheet in Inspector (#1914850)
- Nicolas Chevobbe [:nchevobbe] Localize variable tooltip “computed value” string (#1915108)
- Nicolas Chevobbe [:nchevobbe] Rules view crashes because of exception in OutputParser (#1915353)
- Julian Descottes [:jdescottes] Update MDN compat data (131) (#1915423)
- Nicolas Chevobbe [:nchevobbe] Text in CSS variable tooltip does not have enough contrast in dark mode (#1915555)
- Hubert Boma Manilla (:bomsy) select text + tab in Console no longer indents the text (#1915636)
- Nicolas Chevobbe [:nchevobbe] Small values look a bit odd in CSS variable tooltip (#1915887)
- Nicolas Chevobbe [:nchevobbe] Clicking on event badge doesn’t do anything on some pages using jQuery (#1916881)
Leave a Reply