Developer Tools helps developers write and debug websites on Firefox. This newsletter gives an overview of the work we’ve done as part of the Firefox 112 and 113 Nightly release cycles.
Firefox 112
Firefox being an open source project, we are grateful to get contributions from people outside of Mozilla
- Christian Sonne landed a patch to display
subgridin the auto-complete suggestions forgrid-template-*and grid properties in the Rules View (bug)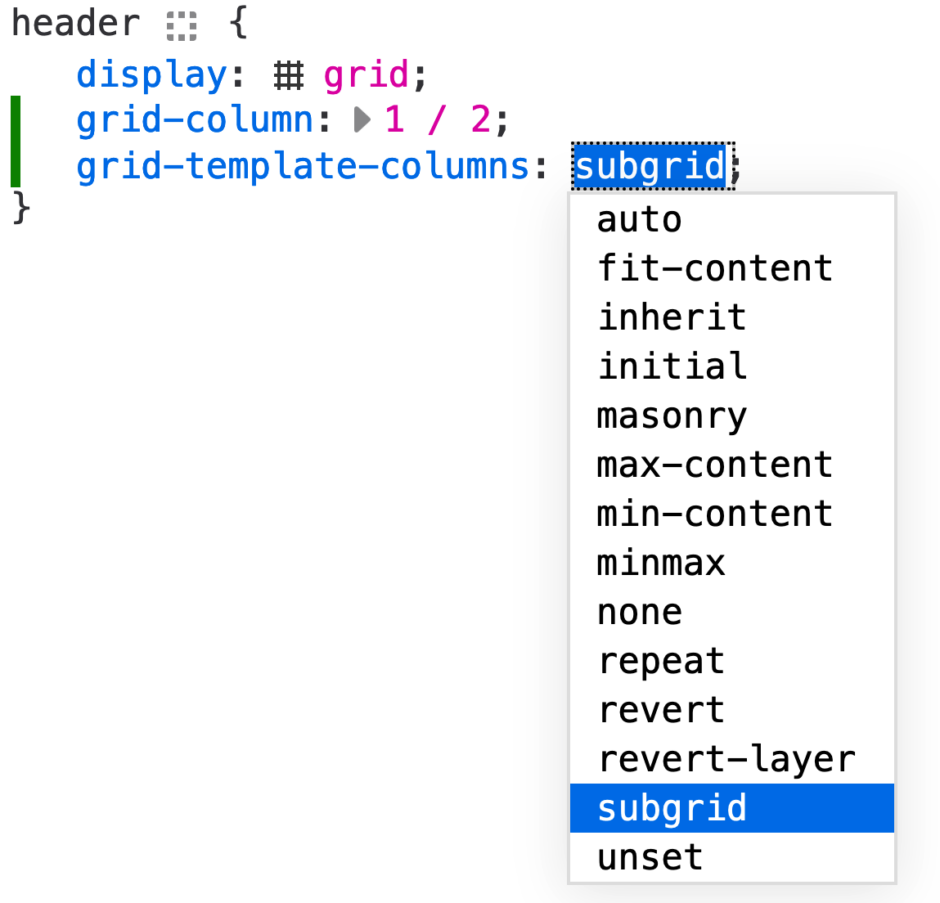
- There are several ways to take screenshots from DevTools and thanks to Connor Pearson, they are now placed in the images folder on OSX (bug)
DevTools are written in HTML, CSS and JS so any web developer can contribute! Read how to setup the work environment and check the list of mentored issues
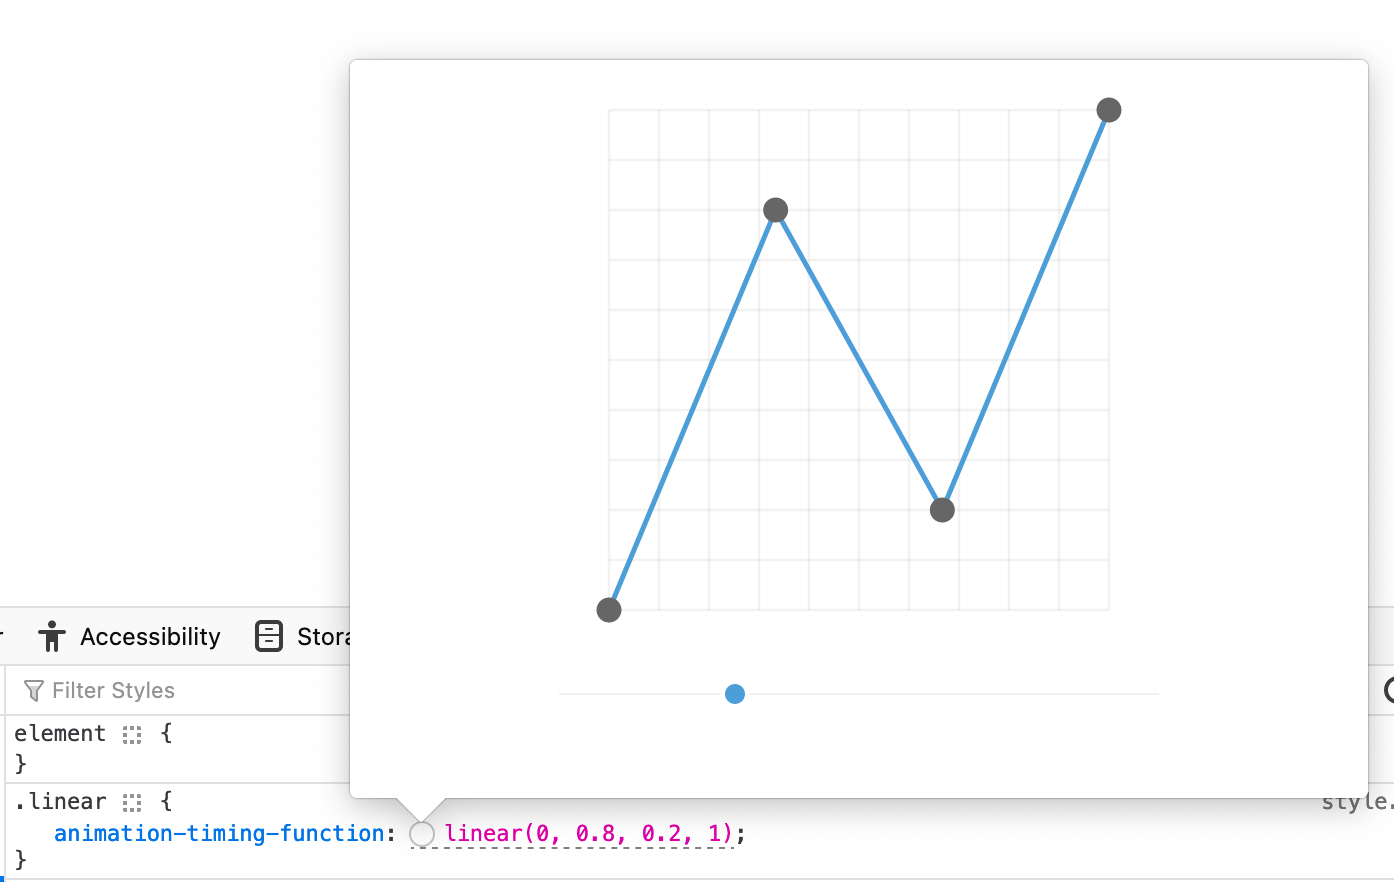
linear() is a new animation timing function that landed in 112 (MDN) and Nicolas added a widget to modify its arguments (bug)
- double clicking on a point will remove it
- double clicking anywhere else will add one
- points can be moved with drag and drop
- holding Shift will snap the point to the grid
Brad improved performance of the grid highlighter (bug) and Alex made some interaction in the debugger 10% faster (> 10% improvements)
We also fixed a few bugs in the tools:
- Emilio fixed an issue that would leave the page in a weird state when closing Responsive Design Mode (bug)
- The “Disable JavaScript” feature was fixed by Julian (bug)
- Julian recovered a regression that broke network throttling in Netmonitor (bug)
- Alex made it possible to copy text from Netmonitor HTML preview again (bug)
- Hubert also fixed an issue with Navigator.sendBeacon requests that were shown as Blocked in the Netmonitor even if they went through (bug)
Firefox 113
We got awesome help from external contributors:
- Masashi Hirano added support for
BigIntin console API methods (bug) - zacnomore improved the display of our pseudo class panel (bug)
Since the beginning of the year, we have been working on features that would help the Web Compatibility team, and hopefully those should benefit all web developers who need to debug websites in production.
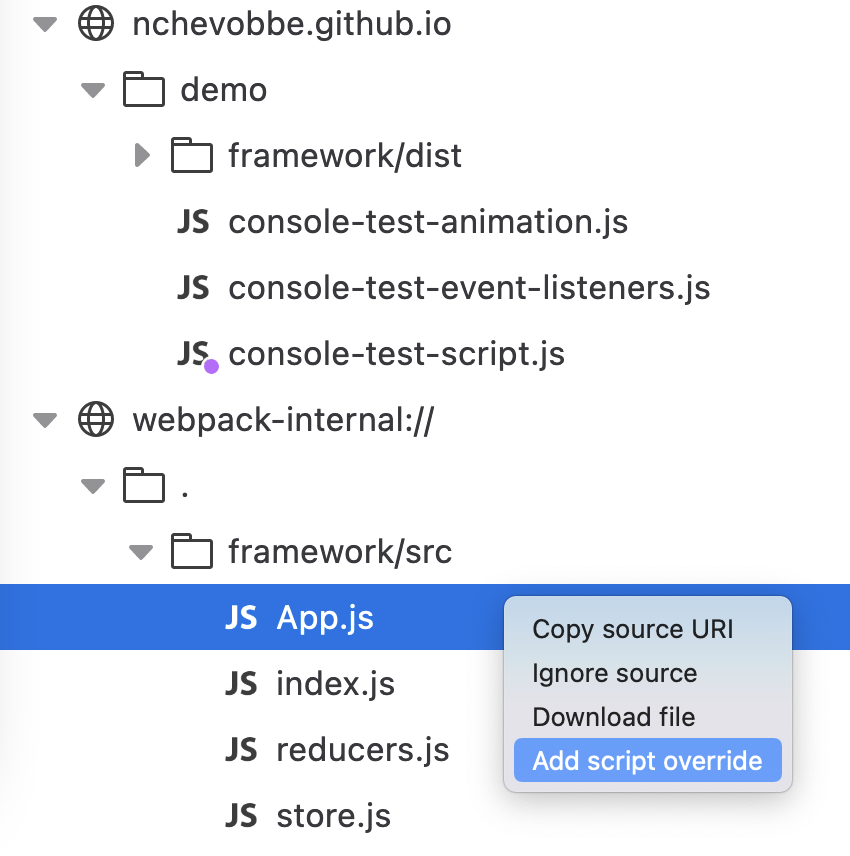
The main feature we added is the ability to override a script from the debugger (bug).
In the Sources tree, a “Add script override” context menu entry was added. It will download the file on your machine, so it can be edited, and then after reloading, the local file is the script that will be used in the page (a purple icon indicates when a file is overridden)
Hubert also landed a lot of improvements for the Debugger “Search in files” feature (aka “Project search”). The panel was moved to a regular side panel, which allows to keep the results list visible while opening scripts in the editor (bug)
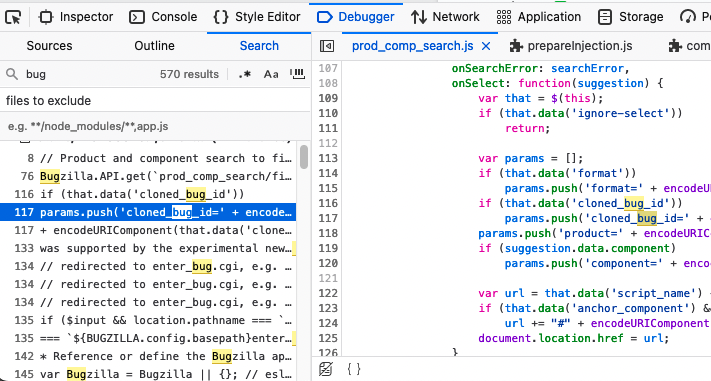
We now show results from minified and pretty-printed tabs (bug), as well as matches from node_modules folder (bug), and we hide results from files that are ignored (bug)
Ignoring files in the Debugger means you won’t step into this file. It can be useful when debugging page built with frameworks so you can focus only on your code. Read how you can ignore files in the Debugger: https://firefox-source-docs.mozilla.org/devtools-user/debugger/how_to/ignore_a_source/index.html
Project search now also supports glob patterns (bug) and search modifiers (bug), so you can do case-sensitive or regex search on specific parts of your project.
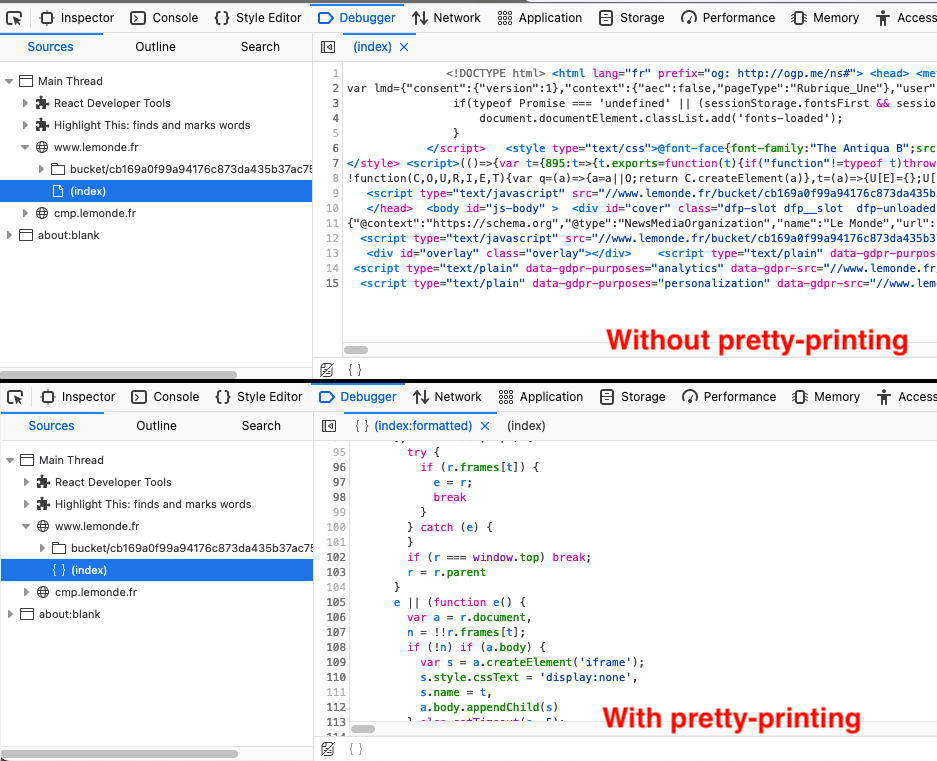
We also spent some time on the Debugger “Pretty-Print” feature
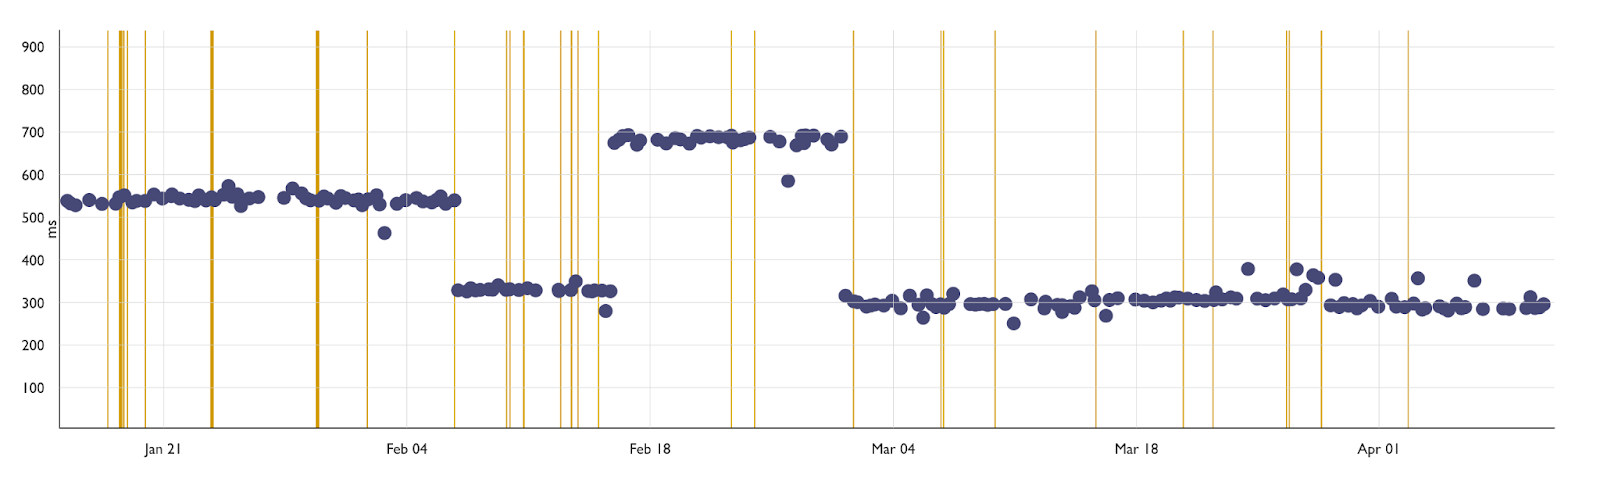
At the beginning of the year, a performance test was added so we can check how our work might impact pretty printing performance, and so we were able to assert that we made it almost twice faster than before (bug, bug, bug)
We added support for pretty printing inline scripts in HTML file (bug) and made it possible to add column breakpoints to any pretty printed source (bug)
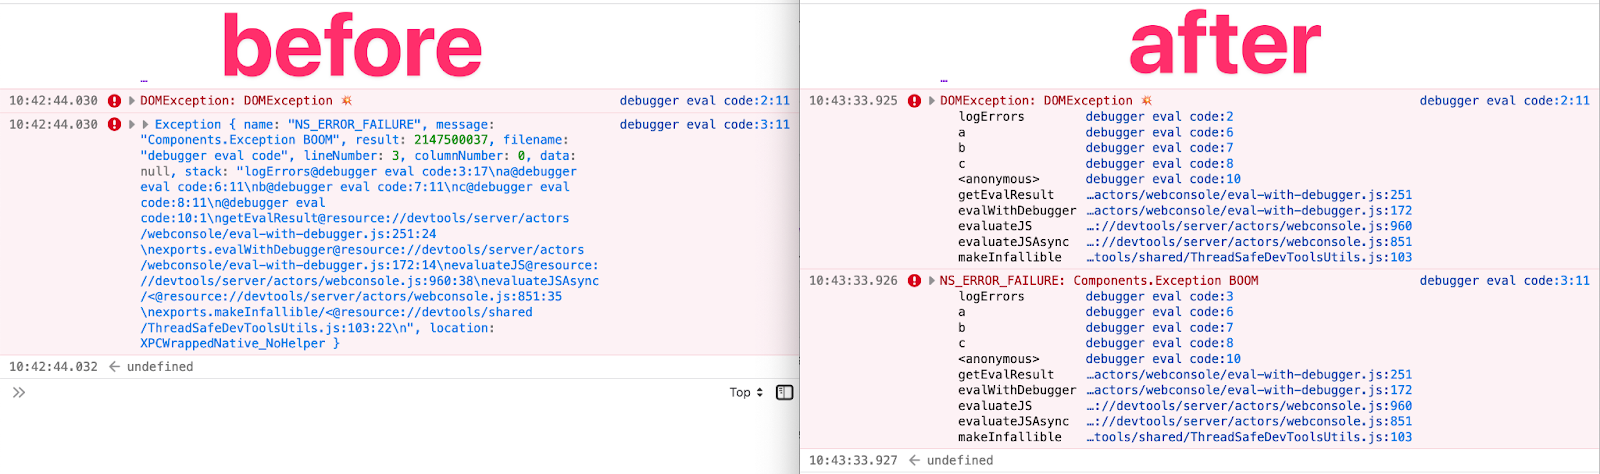
Alex improved logging of DOMException and Components.Exception , showing a nicely formatted stacktrace (bug)
Bug fixes:
- Julian fixed the network monitor performance analysis tools (bug)
- Julian made the simplified highlighter for prefers-reduced-motion optional (bug)
- Nicolas fixed inconsistencies with highlighter icons in various DevTools (bug)
- Nicolas fixed a recent regression which excluded timestamps from console messages when using Copy All Messages / Save All Messages to File (bug)
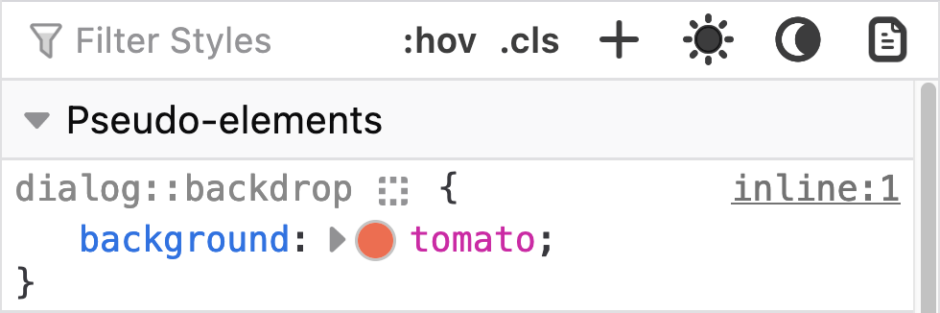
- Nicolas made it possible to see and tweak
::backdropstyles from the inspector (bug)
Leave a Reply