Developer Tools help developers write and debug websites on Firefox. This newsletter gives an overview of the work we’ve done as part of the Firefox 114 Nightly release cycle.
Firefox being an open source project, we are grateful to get contributions from people outside of Mozilla:
- Vasilij Alexsandrovich made changes to our shared Tab component so selecting a tab in the overflow menu will make it visible (bug)
- omid rad fixed the “copy as cURL” command to include the
--compressedargument if the response was compressed (bug) - Ivan Simplify overly complicated
InactivePropertyHelper#hasVerticalWritingMode(bug)
DevTools are written in HTML, CSS and JS so any web developer can contribute! Read how to setup the work environment and check the list of mentored issues
In the Accessibility panel, we used to display internal Gecko role, which were a bit cryptic.
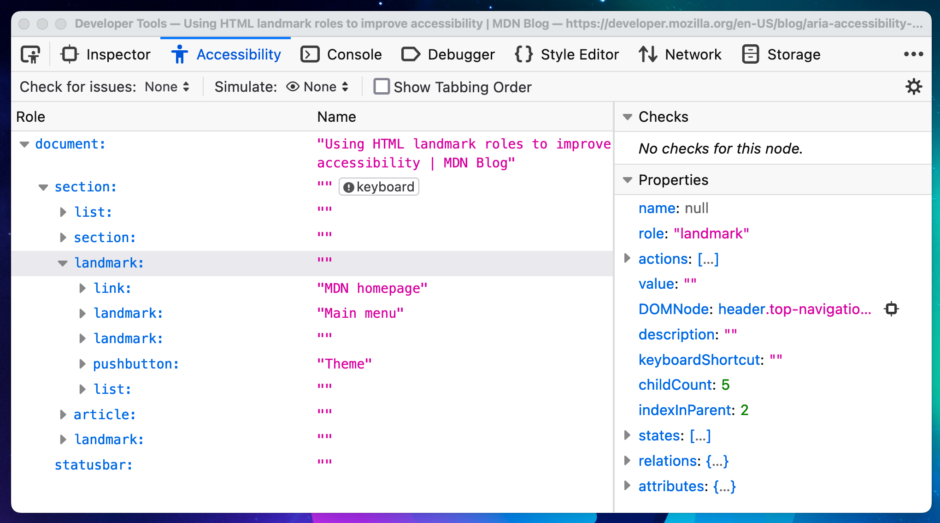
We’re now showing ARIA roles (main, navigation, …), which should be more helpful for web developers (bug).
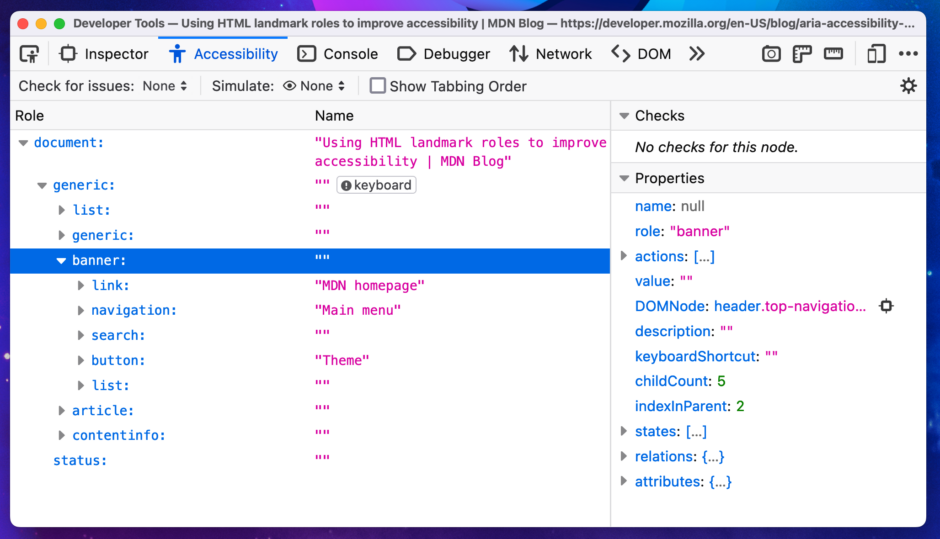
Our MDN friends wrote a lovely article about landmark roles if you want to learn more about them.
Since we’re talking about accessibility, we changed the style of our links in all panels in order to pass WCAG Success Criterion 1.4.1 Use of Color (bug, bug). The underline is applied to links so they can be easily identified, specially for folks who cannot perceive color differences
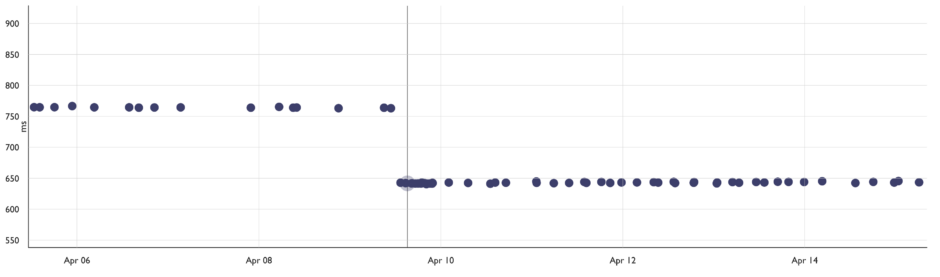
Performance is a high concern for our team and we’re always looking for ways to improve the responsiveness of DevTools. We’re pleased to report that a refactoring of our node walker implementation made some operations in the inspector 10% faster ⚡️ (bug)
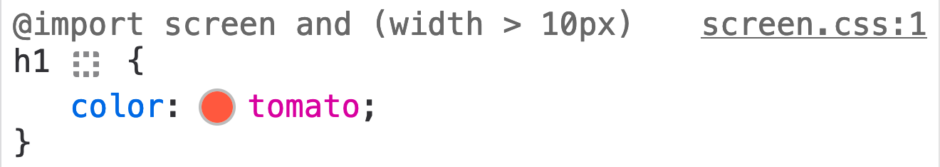
Speaking of the Inspector, we now display media import conditions for @import CSS rules (bug)
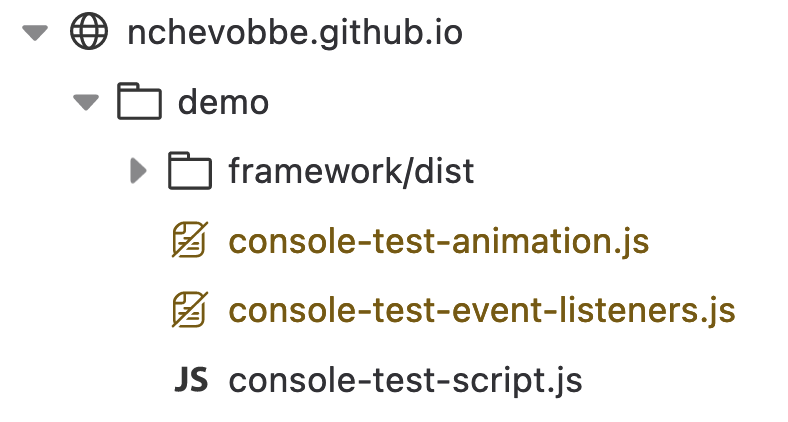
In the Debugger Sources panel, ignored files now have a distinct style
We made a few small improvements to the pretty print feature. It doesn’t add line break for empty object and array literals anymore (bug), it adds a space character between of and [ (bug), and after => (bug), and it better handles the spread operator on array literal (bug).
Miscellaneous bug fixes:
Leave a Reply