Developer Tools help developers write and debug websites on Firefox. This newsletter gives an overview of the work we’ve done as part of the Firefox 120 Nightly release cycle.
Firefox being an open source project, we are grateful to get contributions from people outside of Mozilla.
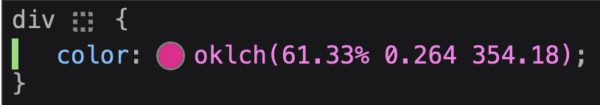
Thanks to Calum Smith who fixed the Inspector to properly display CSS Color 4 formats (for example oklch) (#1859079)
Want to help? DevTools are written in HTML, CSS and JS so any web developer can contribute! Read how to setup the work environment and check the list of mentored issues
Reliable Debugger
This release comes with a few Debugger fixes and tweaks. First, and the most important, we found some tricky issues with the implementation of the variable preview and managed to make it right (#1815472). So if you ever stop using the preview because you felt it was unreliable, give it another go!
We were also aware of buggy behavior when pausing the debugger on unload event and are happy to report that this shouldn’t be broken anymore (#1806796)
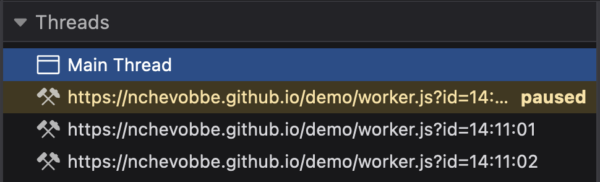
When a website uses workers, we display them in the Threads panel of the debugger. It might happen that a thread execution is paused (because of a breakpoint, a debugger statement or an exception if “Pause on Exception” is enabled), but the others are not. We used to only show a very light pause icon next to paused thread, but this could be easily missed, so we changed it to a bolder style with an explicit “paused” label (#1838393)
Finally, the Wasm-GC proposal adds many new types and opcodes that can show up in the wasm binary, so we added support for them in the debugger (#1855254)
Pretty Style
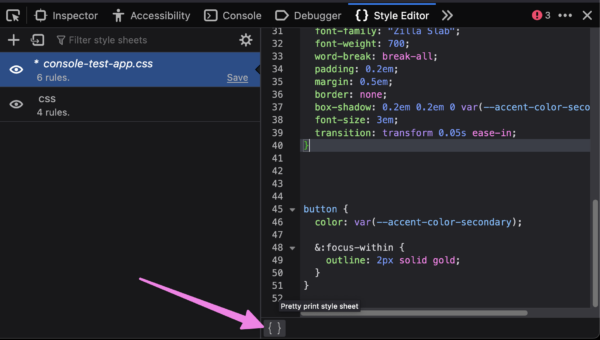
The Style Editor makes it easy to read and modify stylesheets. When it detects a minified file, it will automatically pretty print the stylesheet content. There are cases where we fail to detect that a stylesheet isn’t legible, so we added a button in the bottom left corner, like in the Debugger, that will prettify the file when clicked (#1832213).
Improving DevTools Accessibility
A few months ago, the accessibility team at Mozilla ran an audit of the most used panel in DevTools and handed us over a list of the accessibility issues they found. We’re now in the process of fixing those issues, which will span multiple Firefox releases, and will hopefully make our tools more accessible. We started with the low hanging fruits which can be put in a few categories:
- buttons should communicate their pressed/active state (#1843309, #1844062, #1843358)
- buttons and inputs should be properly labelled (#1844049, #1844086, #1844091, #1855202)
- elements should have enough contrast (#1843337, #1844093)
- it should be easy to distinguish focused elements (#1844074, #1844089)
A combination of all of those went into fixing issues on the event listeners tooltip (#1843328, #1843330, #1843331), which should be properly keyboard and screen reader accessible now.
This is just the beginning of the project and more fixes and changes are coming in future releases. If you’re curious, check the full list of bugs we plan to fix during this project.
Thank you for reading this and using our tools, see you next month for a new round of exciting updates 🙂
Leave a Reply