Developer Tools help developers write and debug websites on Firefox. This newsletter gives an overview of the work we’ve done as part of the Firefox 121 release cycle.
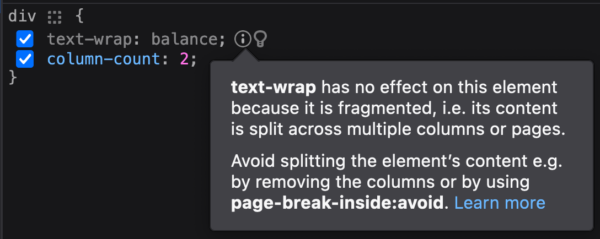
text-wrap (https://developer.mozilla.org/en-US/docs/Web/CSS/text-wrap) is a new CSS property to control how text inside an element is wrapped. The balance value makes it so that:
text is wrapped in a way that best balances the number of characters on each line, enhancing layout quality and legibility. Because counting characters and balancing them across multiple lines is computationally expensive, this value is only supported for blocks of text spanning a limited number of lines
MDN
Sebastian Zartner added an inactive CSS warning when text-wrap: balance is ignored (#1851756), which can be because the text spans too many lines, or if the text is split across multiple columns.
Firefox being an open source project, we often get contributions from people outside of Mozilla. In 2023, we’re very grateful that 60 bugs were worked on by 30 unique external contributors. Thanks to all who helped us making Firefox DevTools better this year!
Want to help? DevTools are written in HTML, CSS and JS so any web developer can contribute! Read how to setup the work environment and check the list of mentored issues
:has(:not(.slow))
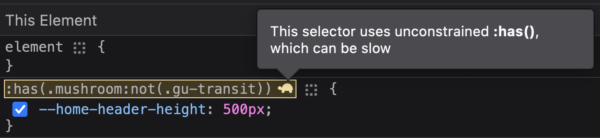
Yes, it’s here (finally as people like to say on social media): The :has() pseudo-class (aka “parent” selector), landed in Firefox, and is now available in all major browsers 🥳. We are probably as excited as you are to be able to have this new ability to style some elements where we would previously need to add specific classes in JS.
As always with powerful technologies, this might come with a catch. The CSS engine now has to check more things to retrieve the elements matching a selector using :has(). In order to spot potential performance issues, there will be a icon next to rules that we think could be problematic (#1863006).
This is not a silver bullet though, and this might actually be okay if the page you’re using it on doesn’t have a lot of elements.
Elements relationships
Some HTML attributes (for, aria-labelledby, …) are used to reference specific element ids in the page. The markup view already allowed to select the referenced node, either by Ctrl (Cmd on macOS) + click on the attribute, or via the context menu displayed on the attribute. As we got reports, even from Mozilla employees, who wanted this already existing feature, we figured out this wasn’t very discoverable.
As a result, there’s now an icon in the markup view next to the id reference (#1850953). Clicking on it will select the referenced node so you can quickly check its attributes, content or applied rules.
Debugger, don’t break
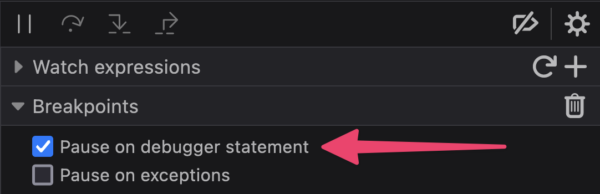
Did you know that you could pause in the Debugger without adding breakpoints in the UI? That’s right, adding a debugger statement in your code will make the Debugger pause at this very location. This can be extremely useful, but can also be frustrating if said debugger statement is in a hot path, or on a website you need to debug but don’t have access to the code.
We don’t like frustrated users, we want to make life as easy as possible for web developers, so we added a checkbox (#1578220) that you can uncheck to avoid pausing on debugger statements.
We also fixed a bug with the variable tooltip that could display erroneous values when line wrapping is enabled (#1815472).
Accessibility
As said in the previous newsletter, we’re working on accessibility issues in the toolbox, and fixed a few of them in this release:
- Fixed color contrast for filtered properties, pseudo-class and unmatched selectors in the Rules view (#1843335, #1843343, #1863472, #1844958)
- Added proper aria attributes on our Accordion component, used in the Debugger and Inspector (#1843318)
- Made Debugger sections (Threads, Watch Expressions, …) appear as different semantic regions (#1843319)
- Fixed keyboard navigation of stacktrace frame in the console (#1844092)
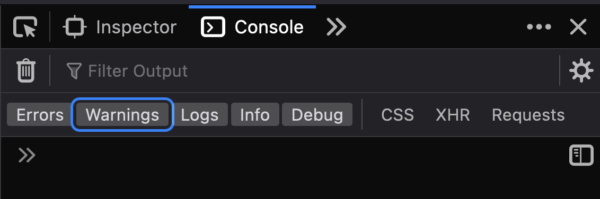
The most visible change here is the change we made to our focus indicators across the toolbox (#1855200, #1865047, #1862142) that should make keyboard navigation much easier
The project is coming to an end, but we still have changes coming in future releases, and we’ll likely have another project next year to take care of issues in other tools like the Network panel.
Miscellaneous
SharedArrayBuffer objects logged from Worklets are now displayed in the Console (#1860888).
We addressed a bug impacting VueJS DevTools, where Custom formatters were not called with Proxy objects (#1857722).
Finally, we fixed an issue that could make the Network panel unusable (#1864905).
Thank you for reading this and using our tools, see you next month for a new round of exciting updates 🙂
Leave a Reply