Developer Tools help developers write and debug websites on Firefox. This newsletter gives an overview of the work we’ve done as part of the Firefox 123 Nightly release cycle.
Firefox being an open source project, we are grateful to get contributions from people outside of Mozilla. Many thanks to Aaron who added a “Save as File” context menu entry in the Network panel so (mostly) all responses can be saved to disk (#1221964)
Want to help? DevTools are written in HTML, CSS and JS so any web developer can contribute! Read how to setup the work environment and check the list of mentored issues
Debugger
A source map is a file that maps from a generated source, i.e. the actual Javascript source the browser runs, to the original source, which could be typescript, jsx, or even regular JS file that was compressed. This enables DevTools to display code to the developers in the way they wrote it.
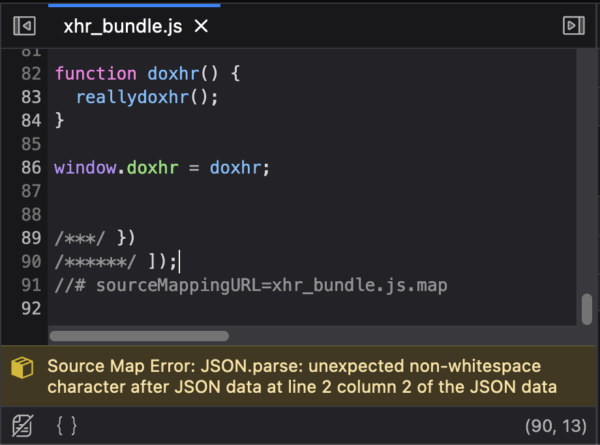
It can happen that a referenced source map file can’t be retrieved by the Debugger, or that it’s invalid, and in such case, we’ll now show a warning message in the editor to indicate why we can only show the generated source (#1834725).
Still related to source map, a link to the original source is now displayed in the footer when selecting a location in a generated source (#1834729).
We some time fixing common issues that were affecting the Preview Popup, which is displayed when hovering variables (#1873147, #1872715, #1873149). It should now be more solid and reliable, but less us know if you’re still having problem with it!
Finally, we fixed a nasty bug that could crash the Debugger (#1874382).
Misc
We vastly improved console performance when there is a lot of messages being displayed (#1873066, #1874696) and fixed logging of cross-origin iframe’s contentWindow (#1867726) and arrays in workers (#1874695).
The Network panel timing markers for Service Worker interception are now displayed correctly (#1353798).
We fixed a couple regressions in the Inspector. The first one was preventing using double click edit attribute with URLs in the markup view (#1870214), and the second was adding extra line when copy/pasting rule from the Rules view (#1876220).
Thank you for reading this and using our tools, see you next month week for a new round of updates 🙂
Leave a Reply