Developer Tools help developers write and debug websites on Firefox. This newsletter gives an overview of the work we’ve done as part of the Firefox 124 Nightly release cycle.
Firefox being an open source project, we are grateful to get contributions from people outside of Mozilla:
- Oliver Schramm fixed the Geometry Editor which could be misplaced when the page was zoomed in (#1877890)
- Redfirerf corrected an erroneous comment in our Console API implementation (#1879991)
Want to help? DevTools are written in HTML, CSS and JS so any web developer can contribute! Read how to setup the work environment and check the list of mentored issues
Performance project
As we were wrapping up projects at the end of 2023 and discussing plans for 2024, we decided that the whole team would spend a couple months focusing on known performance issues. We stuck to the plan and are proud to start reporting the fruits of our labor ⚡️
We already did a similar project last year with great results, especially on the Console and the Debugger, but this time we felt like the Inspector needed some love too, fixing reports of extreme cases that make DevTools crumble.
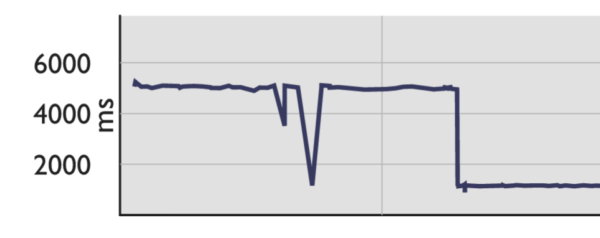
For example, we had a bug filed a few years ago where displaying 10000 rules was hanging the Rules view (#1247751). A specific function, used to compute information about the CSS Rules, was taking 7000ms (yes 7s) on my machine. After giving it a very hard look (and providing a patch), it now only takes around 50ms, a very nice 99% improvement!
Last month, we already reported some improvements on the Console when it contains a lot of messages. We kept digging (#1875045) and the Console is now almost 5 times faster when adding new messages when there’s already more than 10000 messages displayed. Our performance test also reports a 25% improvement when reloading the Console.
Coincidentally, we got a report (#1879575) from a Mozilla employee that the Debugger was freezing on one of their project, which had
a lot of JavaScript files. We analyzed the performance profile they recorded with the Firefox Profiler and were able to reduce the time spent adding sources by 25%.
Finally, we started some preliminary work to remove the main source of slowness in the Debugger: Babel, which we use to build Abstract Syntax Trees. For example, we use this to build the expression we need to evaluate to display properties in the Variable Tooltip. Babel is great, but we want to explore and see if we can get faster performance in other ways.
And you know the saying, when you have a hammer, everything looks like a nail, and so we implemented a few things over the years, relying on Babel, where something faster could have been used. So first, we’re going to remove all the unnecessary usage of Babel (#1878061 is a first step).
And then, since we’re using CodeMirror to display the file content, and given that the newest version of CodeMirror uses a very capable and efficient parser (Lezer), we’re going migrate to this new version (we’re still using version 5), in the hope of reusing part of what CodeMirror is already doing to display the source.
We’re using CodeMirror in quite a few places, and some consumers are making extensive usage of its different APIs, so the migration will take a bit of time. For now, we started small and migrated our first consumer, the EventTooltip in the markup view (#1878605).
Various fixes and improvements
Although we’re focusing a lot of our time on performance, we’re still actually maintaining the toolbox and fixing annoying bugs that our wonderful users report in Bugzilla. In no particular order we:
- fixed an issue in the Debugger variable tooltip when hovering variables named
values(#1876297) - ensured that text selection works fine in the Debugger (#1878698, #1880428)
- prevented CSS values to be translated in the Inactive CSS tooltip (#1878651)
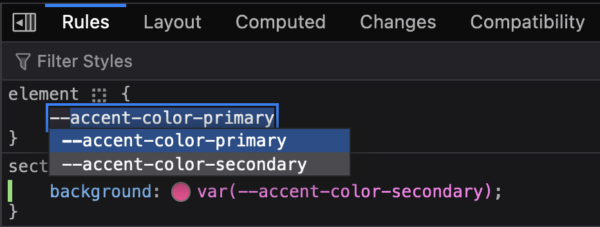
- fixed the autocomplete for color CSS variables in the Inspector (#1582400)
Speaking of the Inspector, the property name will now autocomplete with existing CSS variables (#1867595), making very easy to redefine them on a given CSS rule:
Finally, a setting was added in the preference panel to control if the Enter key should move the focus to the next input in the Rules view (#1876694), for those of you who liked the behavior we briefly added (and reverted) in 122 (see https://fxdx.dev/rules-view-enter-key/)
Thank you for reading this and using our tools, see you next month for a new round of updates 🙂
Leave a Reply