Developer Tools help developers write and debug websites on Firefox. This newsletter gives an overview of the work we’ve done as part of the Firefox 125 Nightly release cycle.
Firefox being an open source project, we are grateful to get contributions from people outside of Mozilla, like Artem Manushenkov who updated the Debugger Watch Expressions panel input field placeholder (#1619201)
Want to help? DevTools are written in HTML, CSS and JS so any web developer can contribute! Read how to setup the work environment and check the list of mentored issues
Pop it up!
Firefox 125 adds support for the Popover API, which is now supported across all major browsers 🎉. As said on the related MDN page:
The Popover API provides developers with a standard, consistent, flexible mechanism for displaying popover content on top of other page content. Popover content can be controlled either declaratively using HTML attributes, or via JavaScript.
In HTML, popover elements can be declared with a popover attribute. The popover can then be toggled from a button element which specifies a popovertarget attribute referencing the id of the popover element.
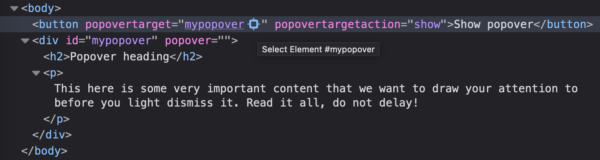
In the Inspector markup view, an icon is displayed next to the popovertarget attribute so you can quickly jump to the popover element.
Popover element can be toggled in Javascript HTMLElement.showPopover, HTMLElement.hidePopover and HTMLElement.togglePopover. beforetoggle and toggle elements are fired when a popover element is toggled, and the Debugger provides those events in the Event Listeners Breakpoints panel.
Note that we don’t display ::backdrop pseudo-element rules yet, but will be soon (target is Firefox 127, see #1893644)
Performance
As announced in the last newsletter, we’re focusing on performance for a few months to provide a fast and snappy experience to our beloved users. We’re happy to report that the Style Editor panel is now up to 20% faster to open (#1884072).
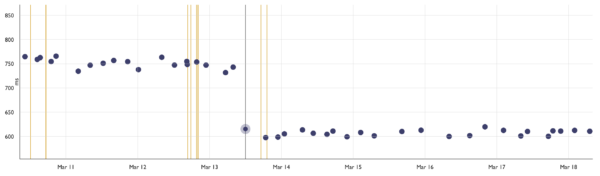
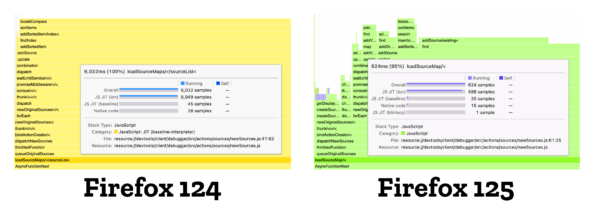
We also improved the Debugger opening when a page contains a lot of Javascript sources (#1880809). In a specific case, we could spend around 9 whole seconds to process the different sources and populate the sources tree (see the 124 Firefox profile). In 125, it now only take a bit more than 600 milliseconds, meaning it’s now 14 times faster (see the 125 Firefox profile).
This also shows up on less extreme cases: our performance tests reported an average of 3% improvement on Debugger opening.
Debugger
There is now a button indicating if the opened file is an original file or a bundle, or if there was an issue when trying to retrieve the Source Map file (#1853899).
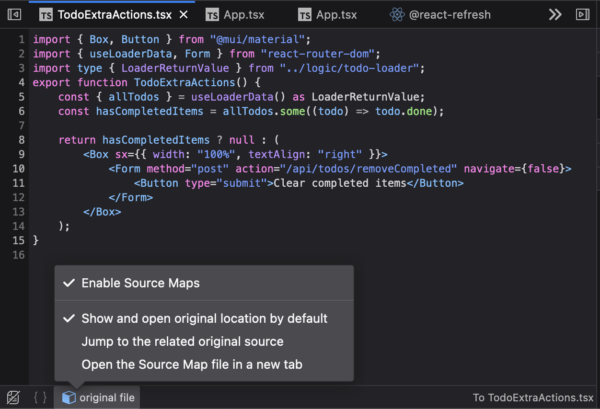
Clicking on the button opens a menu dedicated to Source Map, where you can:
- enable or disable Source Map
- indicate if the Debugger should open original files by default
- select the related original/bundle source
- open the
.mapfile in a new Firefox tab
We also fixed a glitch around text selection and line highlighting (#1878698), as well as an issue which was preventing the Outline panel to work properly (#1879322). Finally we added back the preference that allows to disable the paused debugger overlay (#1865439). If you want to do so, go to about:config , search for devtools.debugger.features.overlay and toggle it to false.
Miscellaneous
- CSP error messages in the Console now provide the effective directive (#1848315)
Infinitywasn’t visible in the Console auto-completion menu (#1698260)- Clicking on a relative URL of an image in the Inspector now honor the document’s base URL (#1871391)
- An issue that could provoke crashes of the Network Monitor is now fixed (#1884571)
Thank you for reading this and using our tools, see you in a few weeks for a new round of updates 🙂
Leave a Reply